


The analytics firm Glassnode has revealed how the trend in the Bitcoin Realized Loss could imply sellers may be starting to reach exhaustion.
Bitcoin Realized Loss Is Showing Signs Of Saturation
In a new post on X, Glassnode has talked about how the Bitcoin capitulation has looked during the latest price drawdown. The on-chain indicator of relevance here is the “Realized Loss,” which measures, as its name suggests, the total amount of loss that the investors on the Bitcoin network as a whole are ‘realizing.’
The metric works by going through the transaction history of each coin being moved or sold on the blockchain to see what price it was transacted at prior to this. If the previous selling price is more than the current spot price for any coin, then its sale is said to be contributing to loss realization.
The amount of loss being realized in the sale is, of course, equal to the difference between the two prices. The Realized Loss calculates this value for all transactions occurring on the network and sums them up to find the total situation.
Like the Realized Loss, there is also an indicator known as the Realized Profit. This metric naturally keeps track of the sales of the opposite type (that is, where last transfer value is lower than the latest spot price).
Now, here is the chart for the Bitcoin Realized Loss shared by the analytics firm that shows the trend in its 6-hour rolling value over the past year:
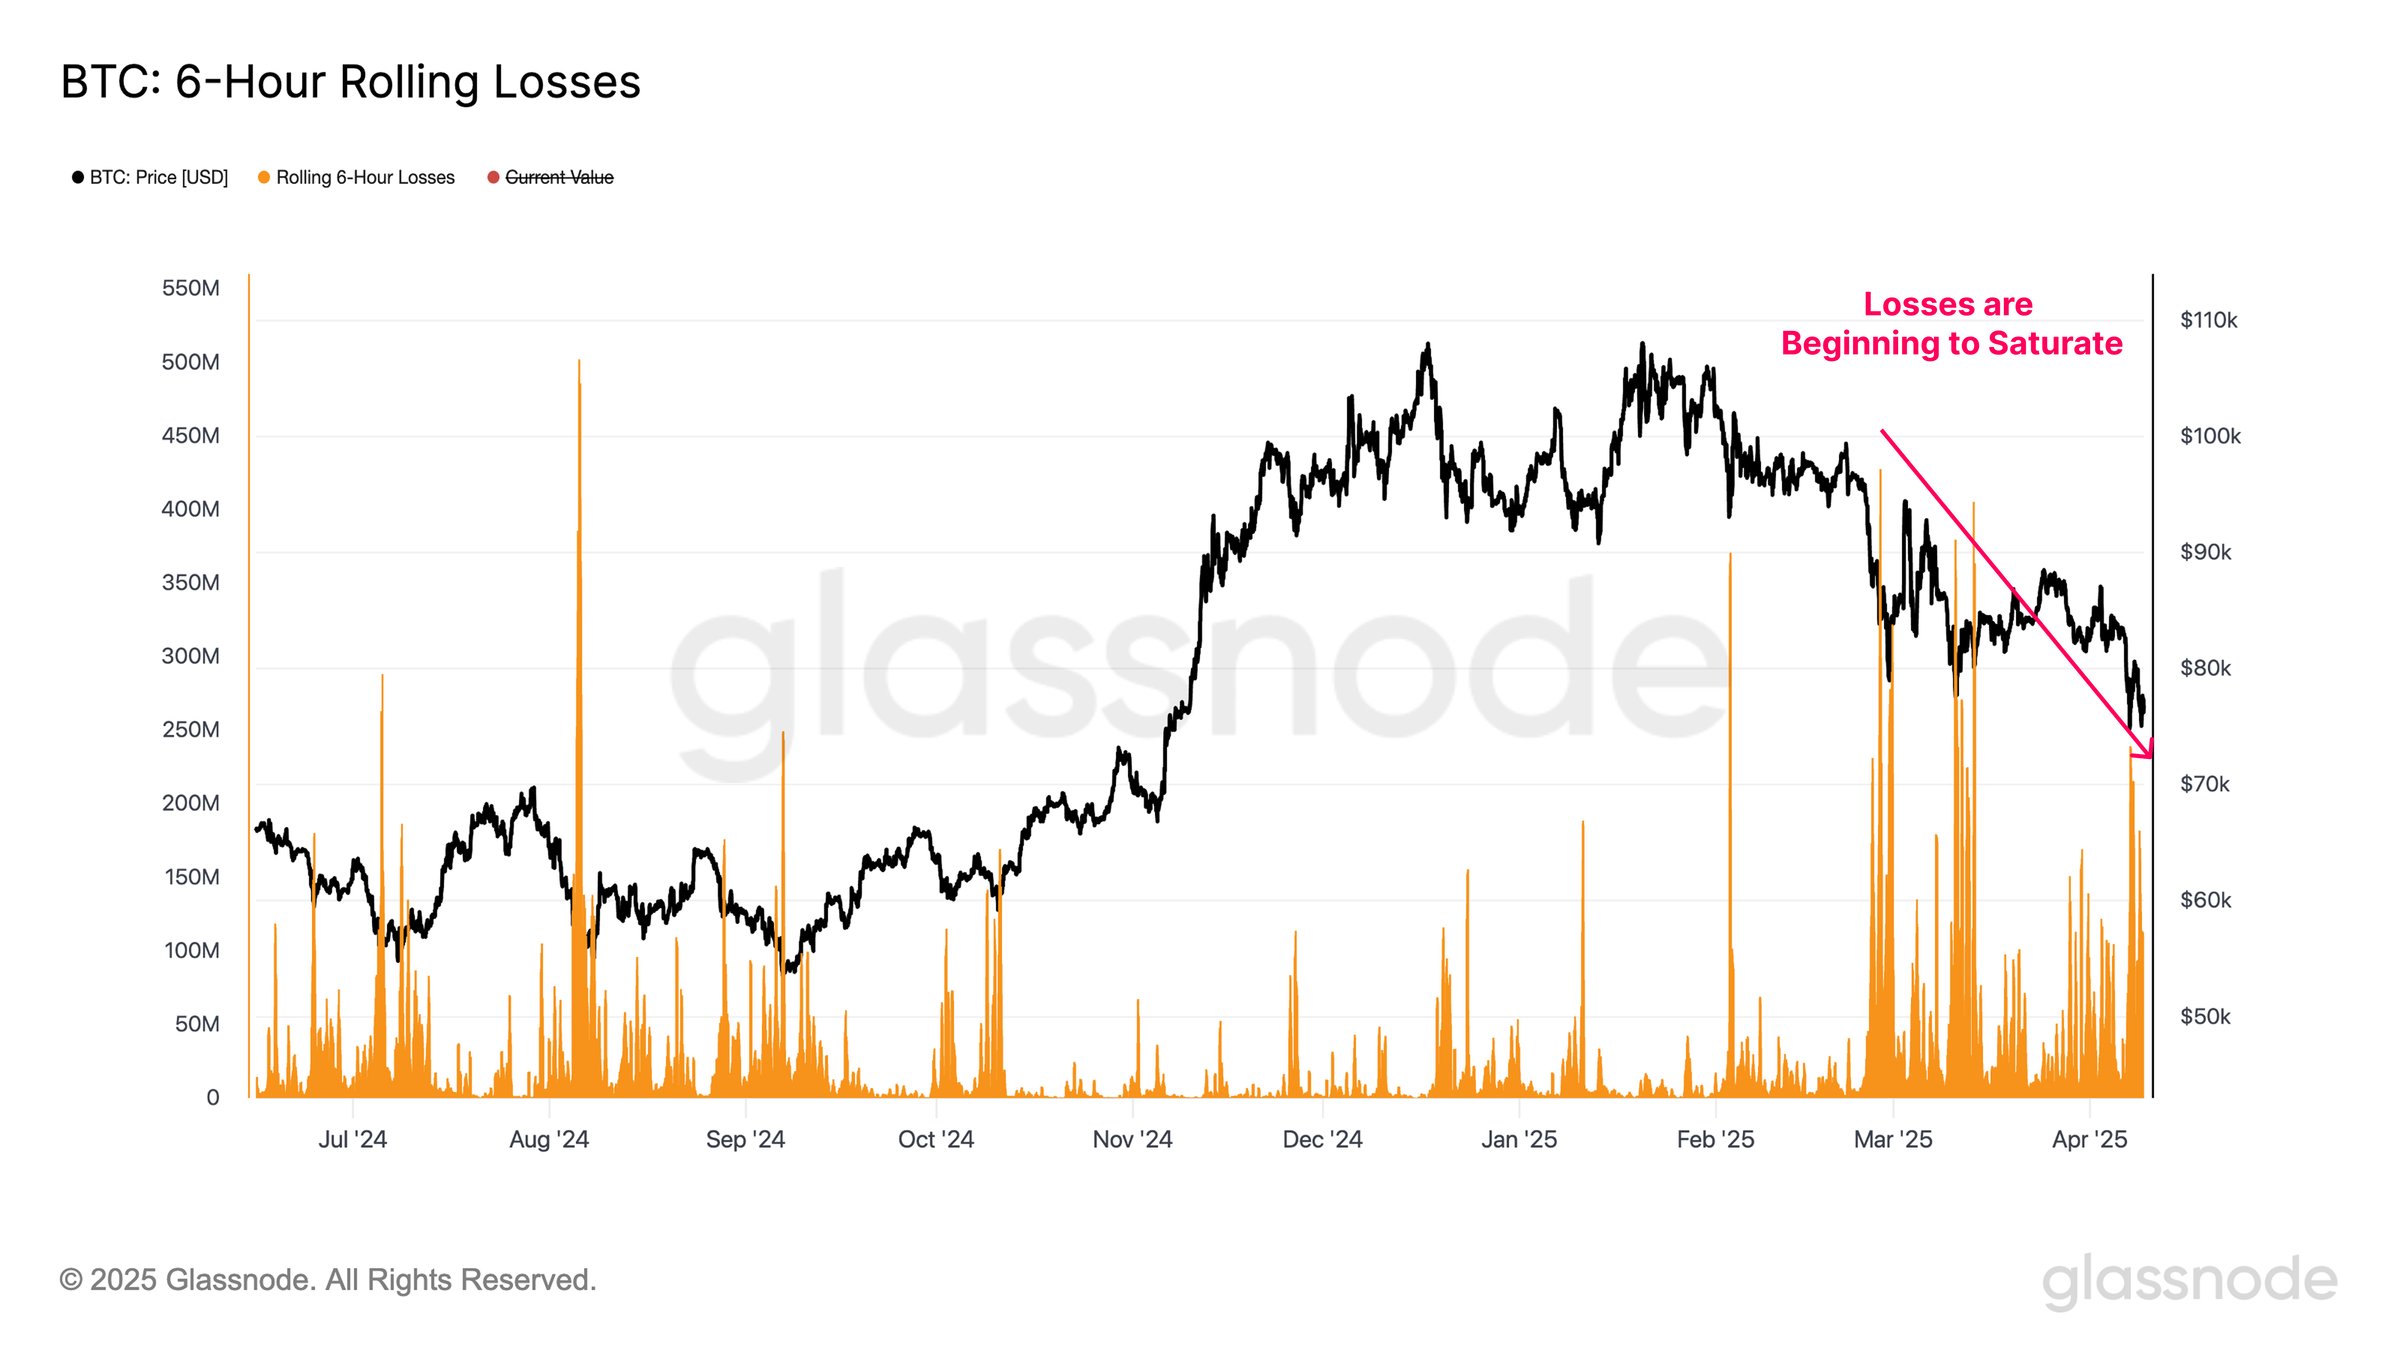
Looks like the value of the metric has observed large spikes in recent days | Source: Glassnode on X
As is visible in the above graph, the Bitcoin Realized Loss observed several large spikes during the bearish price action in February and March, suggesting the investors panic sold their underwater coins.
The recent FUD around tariffs has triggered a continuation of the drawdown for the asset and predictably, the holders have shown sizeable capitulation now as well.
But interestingly, the scale of the 6-hour Realized Loss has been notably lower than the spikes from before. This could imply capitulation is reaching a point of saturation, which, according to Glassnode, may be an early sign that the sellers are becoming exhausted. If so, then it’s possible that BTC may be close to some sort of bottom.
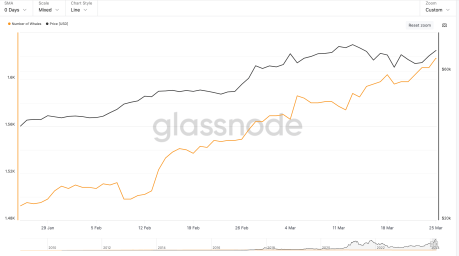
In the same thread, the on-chain analytics firm has also discussed about the recent trajectory in the market cap of the altcoins (that is, the cryptocurrencies excluding Bitcoin, Ethereum, and the stablecoins).
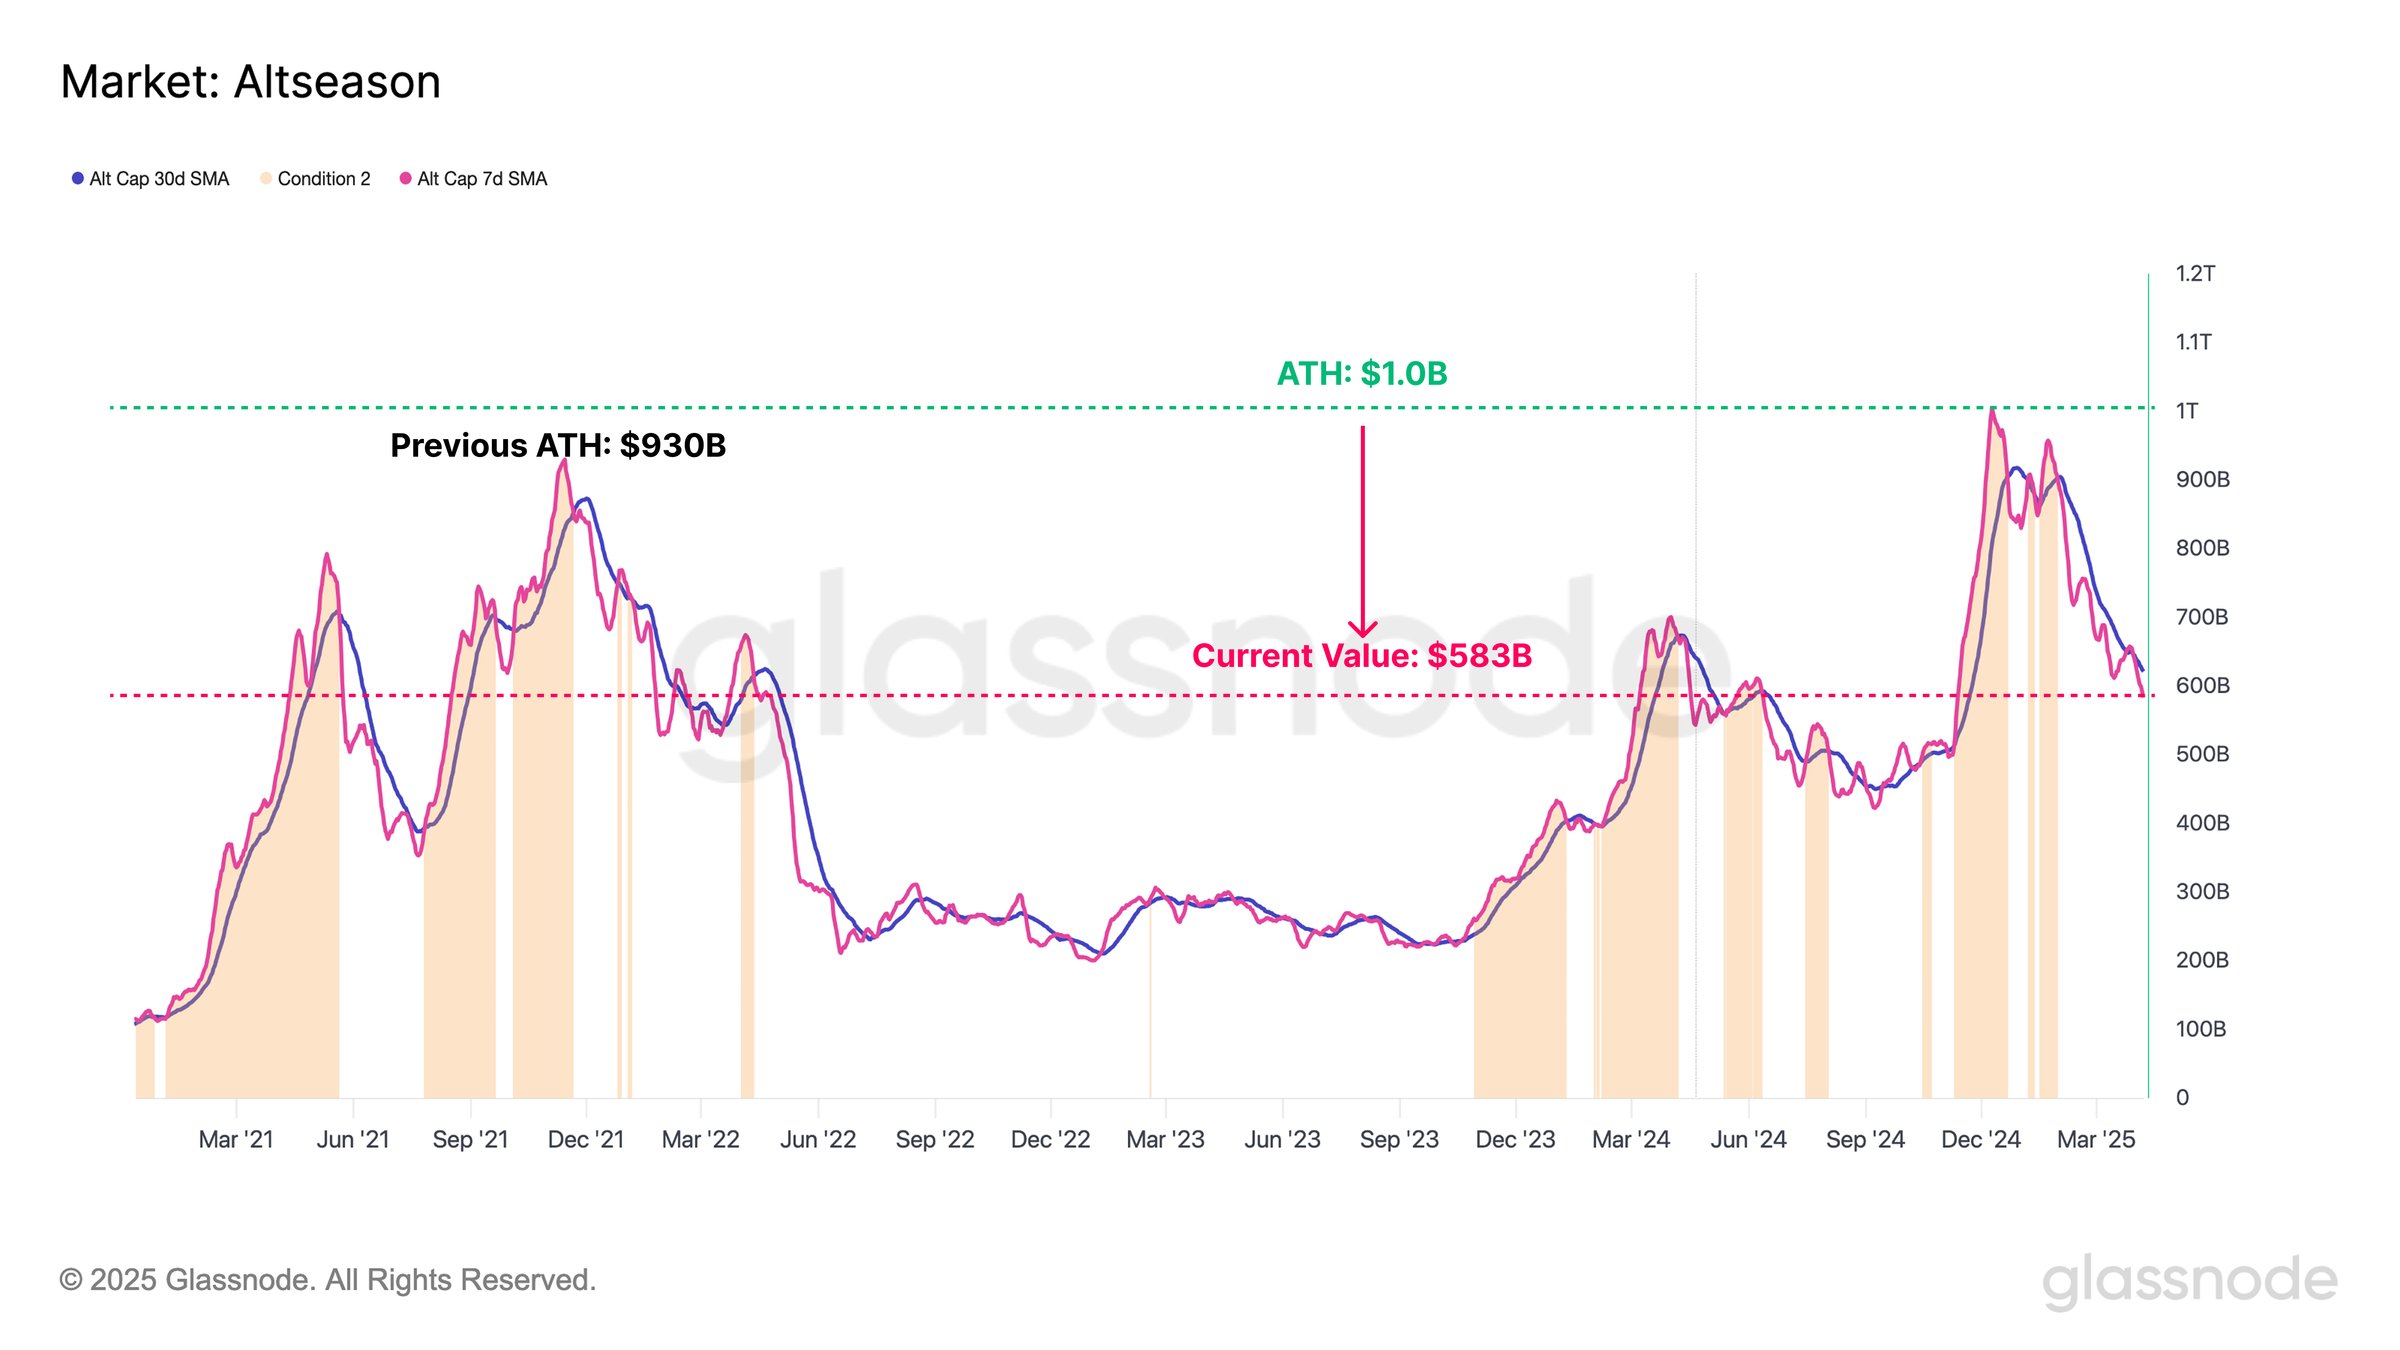
The trend in the combined market cap of the altcoins over the last few years | Source: Glassnode on X
From the chart, it’s apparent that the altcoin market cap was sitting at an all-time high of $1 trillion in December 2024, but today the metric has shrunken to $583 billion. “Assets further out on the risk curve have shown heightened sensitivity to liquidity shocks, leading to severe sector-wide devaluation,” notes Glassnode.
BTC Price
Bitcoin has been making an attempt at recovery during the last couple of days as its price has returned to $81,900.
The price of the coin seems to have been rising recently | Source: BTCUSDT on TradingView
Featured image from Dall-E, Glassnode.com, chart from TradingView.com
Editorial Process for bitcoinist is centered on delivering thoroughly researched, accurate, and unbiased content. We uphold strict sourcing standards, and each page undergoes diligent review by our team of top technology experts and seasoned editors. This process ensures the integrity, relevance, and value of our content for our readers.
Original Source: https://bitcoinist.com/bitcoin-realized-loss-seller-exhaustion-glassnode/

Related Posts:
 Bitcoin Market Remains Bullish: Net Realized…
 Bitcoin Long-Term Holders Are Still Selling At Loss:…
 Bitcoin is Back Into Early Bull Market Territory: Glassnode
 Bitcoin Demand Has ‘Considerably’ Slowed Down,…
 Bitcoin Breaks Above Realized Price Again, Bottom…
 Bitcoin’s Realized Capitalization Hits Record $906B…


